Spector Geo’s Logging feature is an AI-assisted tool that enables geologists to efficiently log, analyze, and classify core samples from imagery. It automates geological feature detection, provides an intuitive visual interface, and integrates with other geological platforms to deliver a comprehensive view of mining sites.
My role was to help the product team transition our barebones native Windows application into an accessible web-based platform. I also introduced a structured product design process to guide feature development and ensure user needs were considered at every stage.
01. BACKGROUND AND GOALS
Before I joined the team, Kore's logging application had been available for a couple of years, primarily used by a small group of early adopters. Our aim was to expand beyond this limited scope and achieve specific product goals:
Enhance Accessibility by transitioning from a native Windows app to a web-based platform.
Increase Data Export Capabilities, enabling users to easily transfer data to other geological software.
My role involved guiding the product team's transition from a basic Windows application to an accessible, web-based solution. Additionally, I introduced a structured product design process to ensure new features aligned closely with user needs, thus fostering a more user-centered development approach.

The original Windows tool lacked essential features for geologists.
02. DISCOVERY
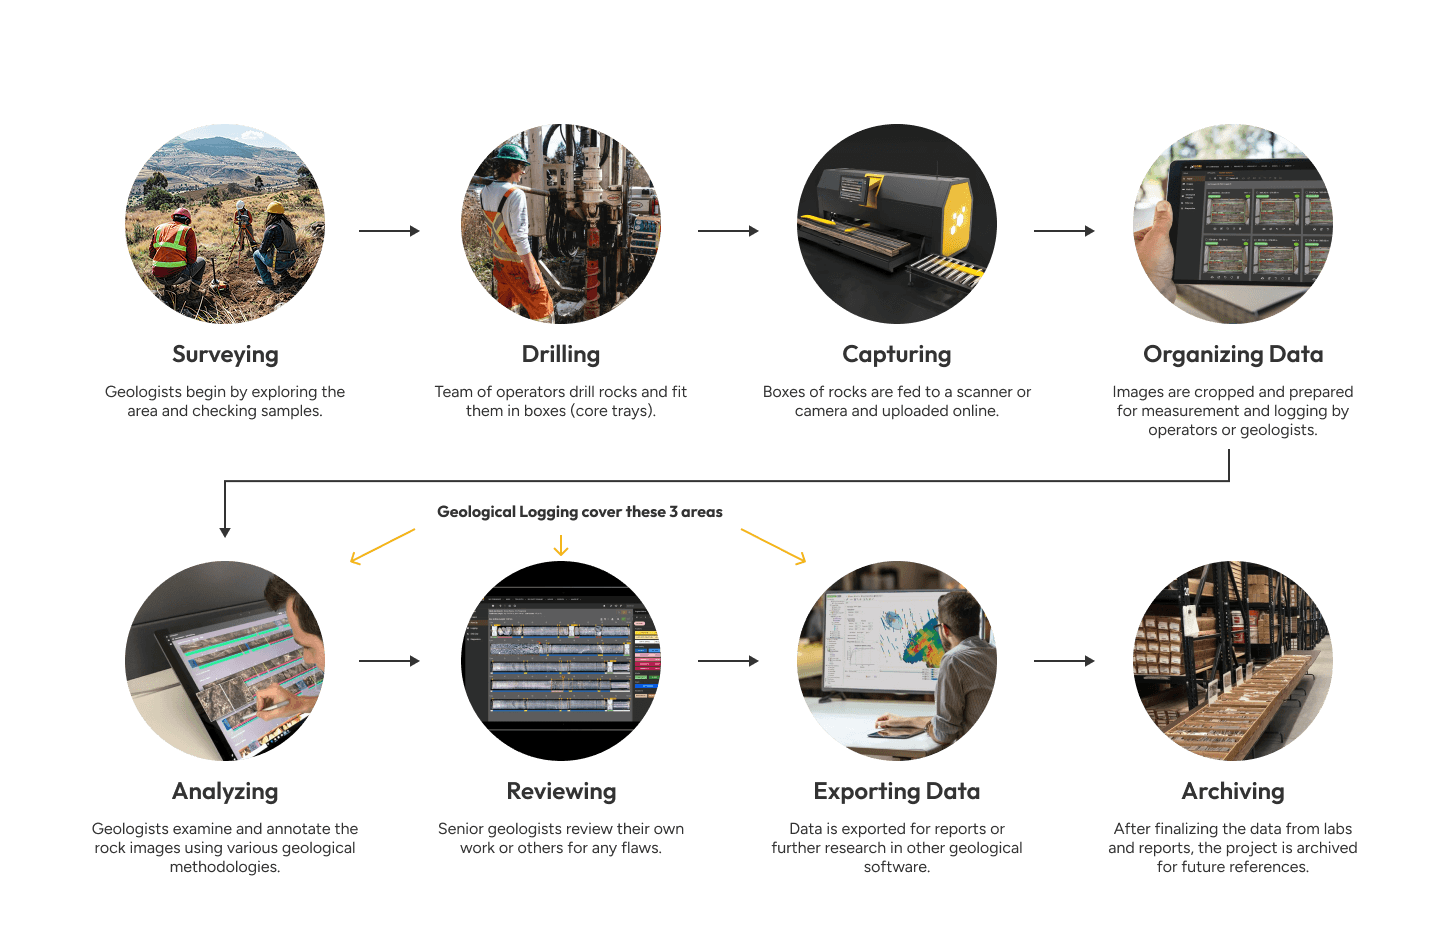
To gain deeper insights, I conducted interviews and observational research sessions with existing customers and our internal geologists. The comprehensive understanding of their workflow was essential to visualize how our products, specifically the image scanner and the Spector Geo application, fit seamlessly into users' daily processes.
At the start of the project, it was crucial to identify and understand our main user groups clearly. Although our users primarily consist of geologists, the research revealed 2 distinct roles involved in the core logging workflow.

Loggers: Geologists who analyze scanned images, annotate geological features, and perform calculations.
Loggers split time between core sheds, field offices, and labs. They’re open to learning new tools and aim to produce high-quality logs by validating AI predictions and reducing errors.
Needs and Goals:
Efficiently log large volumes with consistent accuracy
Build a professional reputation through reliable work
Minimize manual data entry errors
Quickly learn to annotate and interpret logging codes
Use interface views optimized for specific logging tasks
Motivations:
Career advancement and development
Learning from experienced geologists
Contributing meaningful data to exploration
Recognition for attention to detail
Using modern tools to improve traditional workflows
Pain Points:
Limited software training and confusing interfaces
Inconsistent or unclear logging codes and terminology
Missing critical tools like measurement rulers
Cluttered interfaces obstructing rock images
Difficulty referencing previous logs
Connectivity and software stability issues during fieldwork

Reviewers: Senior geologists or project managers who oversee and validate logging results.
Reviewers are senior geologists based in offices with occasional field visits. They oversee data quality across teams and rely on integrated tools to validate, monitor, and guide project outcomes.
Needs and Goals:
Efficiently review and validate logs from multiple teams
Use integrated systems for modeling and estimation
Quickly access and compare logs across projects
Have clear contextual annotations and notes from loggers
Benefit from multiple data views (e.g., strip log, table view)
Streamline data import and export processes
Motivations:
Improve exploration success through better data
Reduce costs while maintaining quality
Mentor junior staff
Standardize data for long-term use
Advance projects from exploration to definition
Pain Points:
Difficulty reconciling data formats across systems
Lack of integration and compatibility with existing corporate tools
Inconsistent data quality from logging teams
Inefficient processes for reviewing annotations and notes
Limited ability to compare and validate logs quickly
I created a service blueprint of the Logger/Reviewer journey and surfaced 3 standout friction points: difficult logging code setup in a separate admin portal that stalls onboarding, depth tags entered twice despite being visible on the images, and a context-poor interface for editing logging codes that leaves users guessing. Presenting the map showed the product team exactly where our personas struggle and gave us a clear, prioritized fix list.

To better inform our design strategy and identify market standards, I conducted a feature comparison analysis with notable geological data platforms, such as MX Deposit, Datarock, and GeologicAI. This allowed us to benchmark against existing solutions, uncover opportunities for differentiation, and validate our design decisions based on industry best practices and user expectations.

MX Deposit is a geological modeling and resource estimation software developed by Seequent, a company specializing in geoscience software solutions.
Offers strong integration with popular geology apps
Provides tiered features and pricing for different roles
Lacks AI and imagery but offers robust calculations
UI splits data entry (table) and visualization (graphs)

Datarock is a company specializing in providing advanced geological data analysis and machine learning solutions for the mining and exploration industries.
AI-powered platform for geological data analysis
Uses OCR and imaging similar to our product
Main UI section shows core images and logging lines
Left sidebar for editing and annotations
Top section is used for navigation and other features

GeologicAI is a technology company that specializes in providing advanced geological data analysis solutions, particularly for the mining and mineral exploration industries.
Combines AI, ML, and imaging for automated logging
Left panel shows logs and supporting data
Middle panel displays scanned rock imagery
Right sidebar contains all logging settings
Working closely with the product owner, I helped document new features based on both user research insights and evolving business needs. We organized all documentation in Confluence to maintain a clear and accessible knowledge base for the team.
This living documentation was continuously updated as we gathered more feedback and discovered new opportunities throughout the project, ensuring alignment between design, development, and user expectations.

03. DESIGN APPROACH
Based on my research, I noticed that our customers rely on three major tasks: analyzing images (primarily by loggers), annotating and logging data (by both loggers and reviewers), and viewing overall calculations across the hole (primarily by reviewers). These tasks emerged consistently during user interviews and workflow observations.
To align with this mental model, I proposed that our UI framework directly support each task, enabling users to stay focused and confident throughout their workflow.

Using the mental model as a foundation, I explored different layout concepts for the logging app. I experimented with both horizontal and vertical arrangements of images and charts to accommodate the diverse workflows of our users.
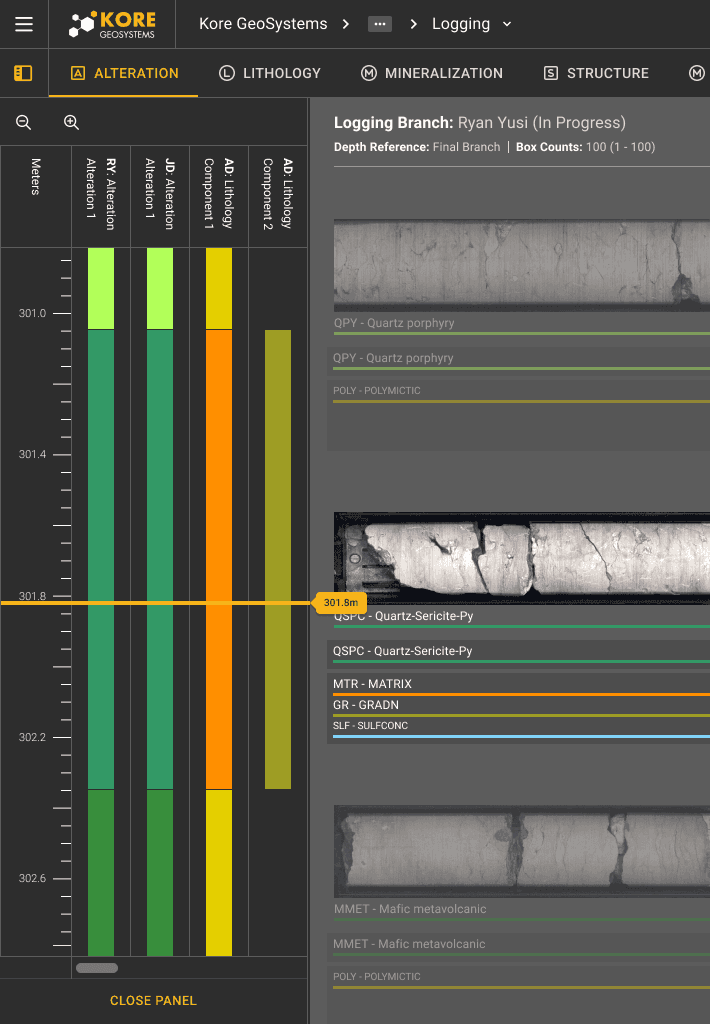
Through interviews, I found that loggers preferred a horizontal stack view of core images, consistent with their current tools, while reviewers favored vertical charts for easier data review. To support both needs, I retained the horizontal layout for logging tasks and introduced a new vertical chart window for review workflows.


Insight: Users felt constrained by the old app's single-window view and manual activation of AI tools.
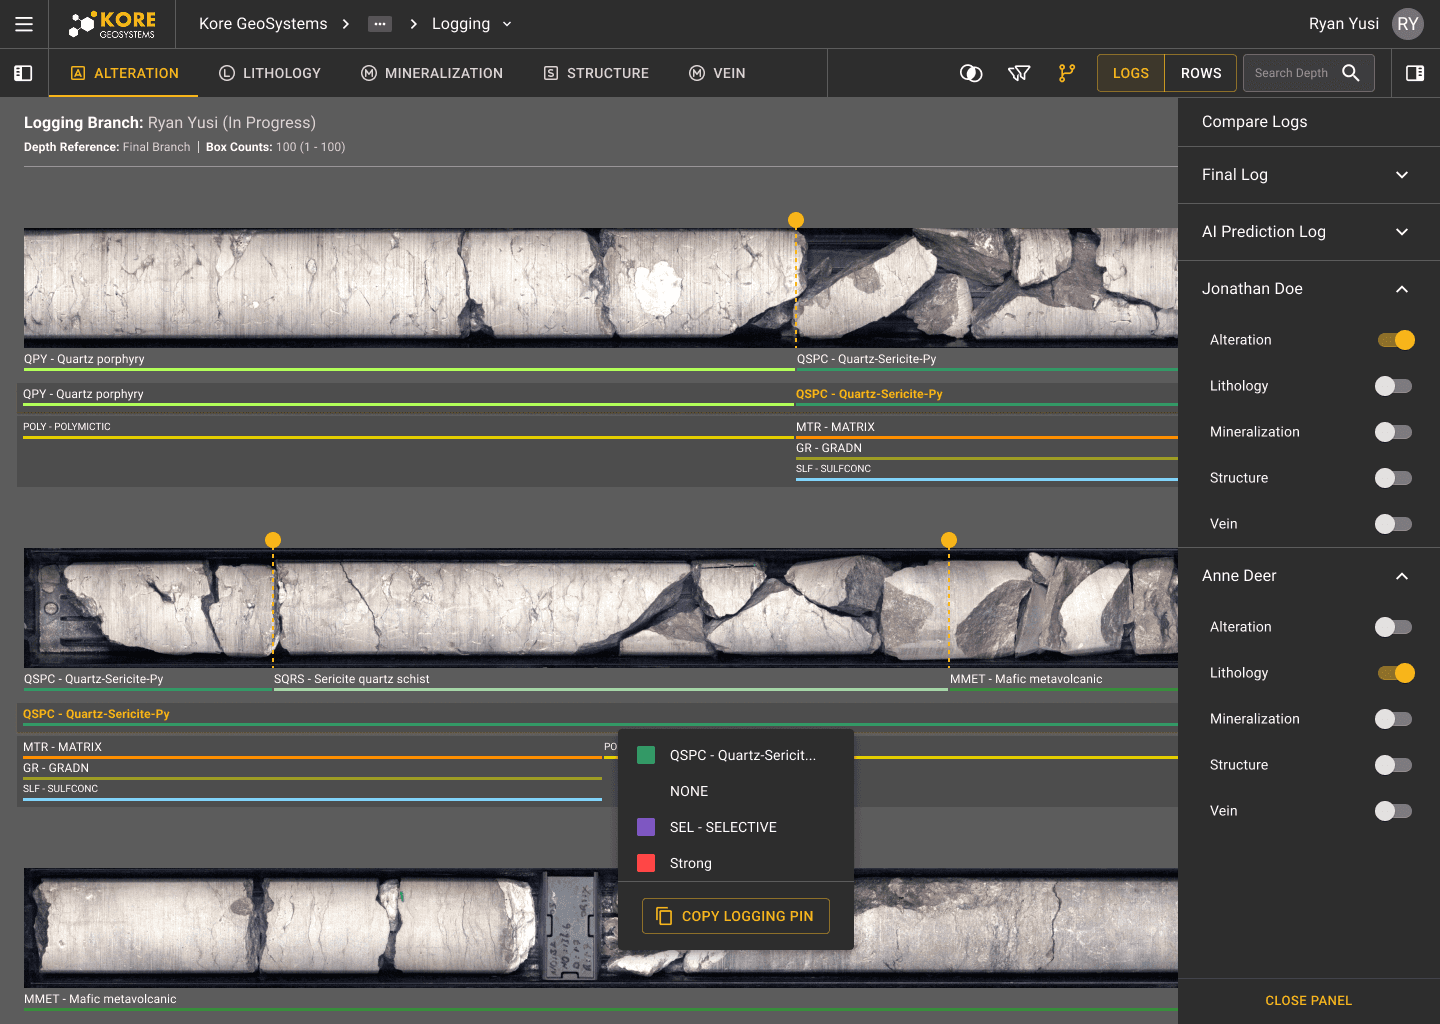
Solution: The new design introduces tailored views for loggers and reviewers, with AI predictions integrated seamlessly into the logging flow.
Insight: New loggers struggled with understanding how to annotate, interpret logging codes, and lacked essential measurement tools.
Solution: Help snippets were added for guidance, logging codes now include contextual text, and a depth ruler shows image location and scale for accurate logging.

Insight: Loggers wanted more screen space dedicated to core images while maintaining the ability to log.
Solution: Inline logging and annotation were introduced, with collapsible windows to maximize visible rock imagery.

Insights: Users lacked the ability to reference coworker's data or reuse past logs.
Solutions: New comparison tool allow viewing and copying of other logs to speed up corrections and maintain consistency.
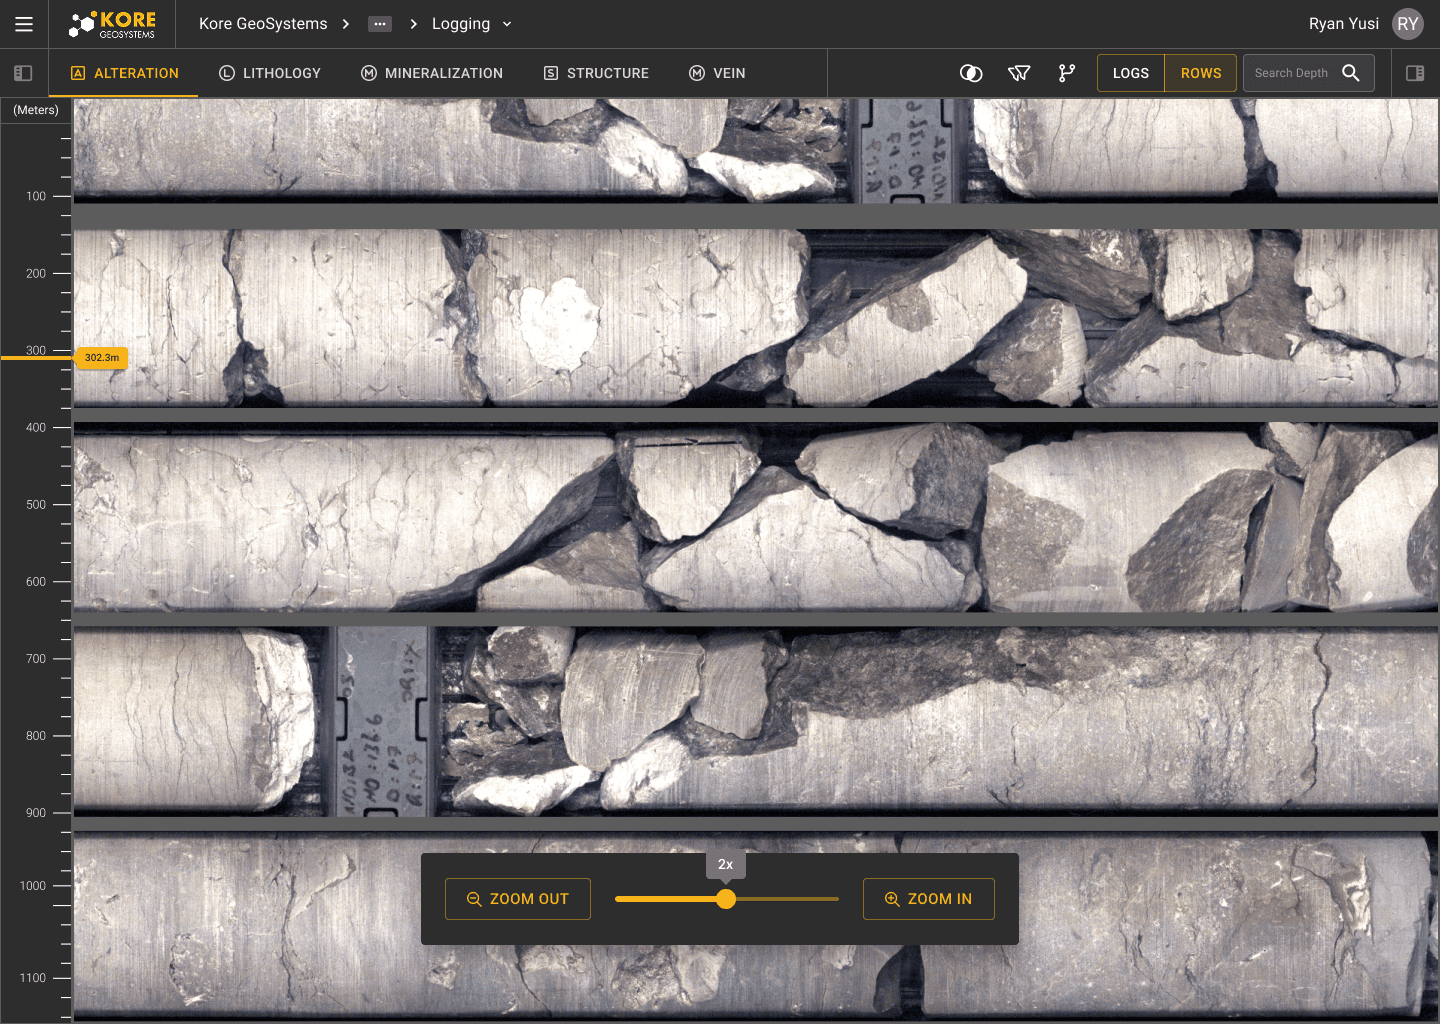
Insight: Previous zoom preview was too small and inconvenient to access.
Solution: A clean zoom mode hides all UI elements for an unobstructed view of rock images.
Solution: Notes and descriptions can now be added and reviewed alongside annotations.

Insight: Users had to manually re-enter existing logging code databases.
Solution: CSV imports were added to streamline code setup from external sources.

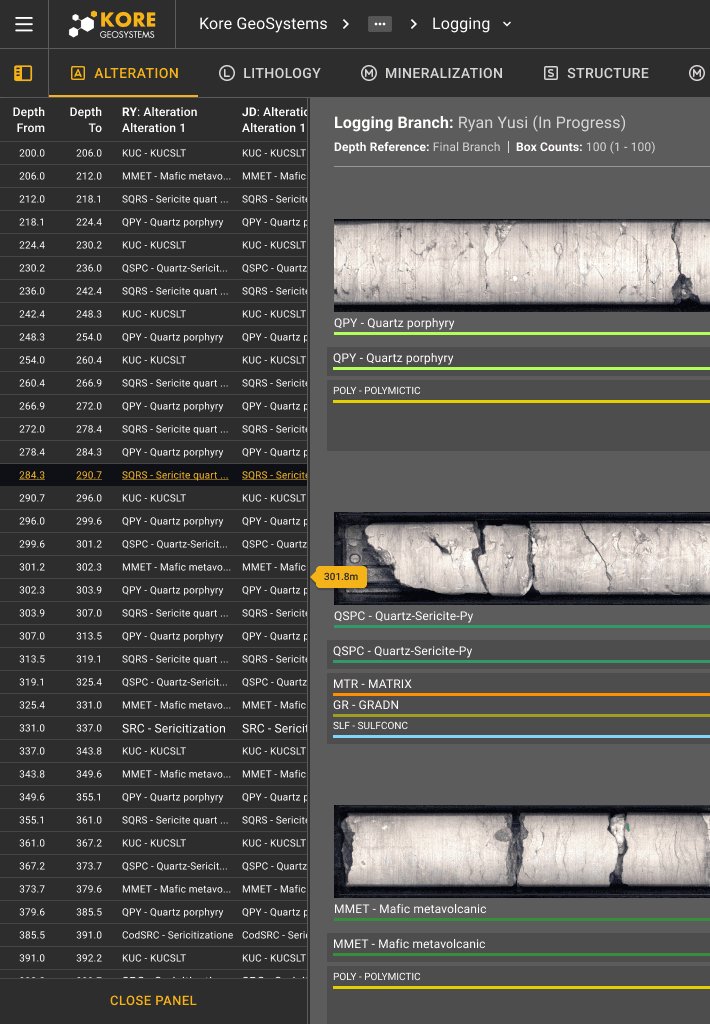
Insight: Reviewers lacked high-level views of core hole data.
Solution: New strip log and table views were introduced to give reviewers a comprehensive data overview.
05. CLOSING
After three months of design work, we released the Logging tool MVP to all customers. We maintained regular communication and continued improving the product with quarterly updates. A year into development, these efforts helped us attract new customers and strengthen our relationships with existing ones. The shift to a web-based platform delivered measurable impact:
Monthly active users grew from fewer than 50 to several hundred geologists over two years.
Monthly data exports increased fivefold compared to the previous app.
User engagement rose, with longer logging sessions per user.
This project also highlighted the value of design thinking in cross-functional teams. I worked closely with in-house geologists to surface and clarify their needs, translating those into actionable solutions for developers. It deepened my understanding of the constraints and possibilities of building for web-based, image-heavy platforms—especially in challenging environments like low connectivity or large data loads. Most of all, it reinforced the importance of user-centered design in transforming legacy tools into scalable, modern solutions.